進入柱狀圖篇章,首節 BarChartSampleDemo.cs 展示了最經典的垂直分組柱狀圖混合折線圖。本節將詳細拆解 BarItem 類別結構、AddBar 方法簽名、Fill 漸層填充、AxisType.Text 文字座標軸、IsTicsBetweenLabels 刻度對齊等核心技術點。
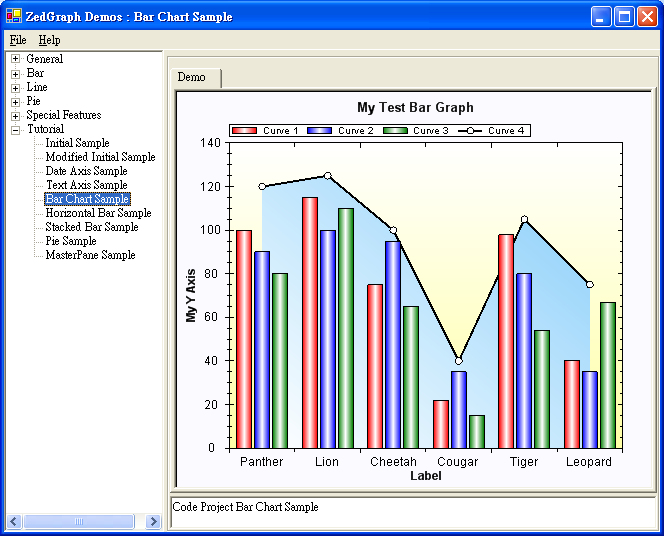
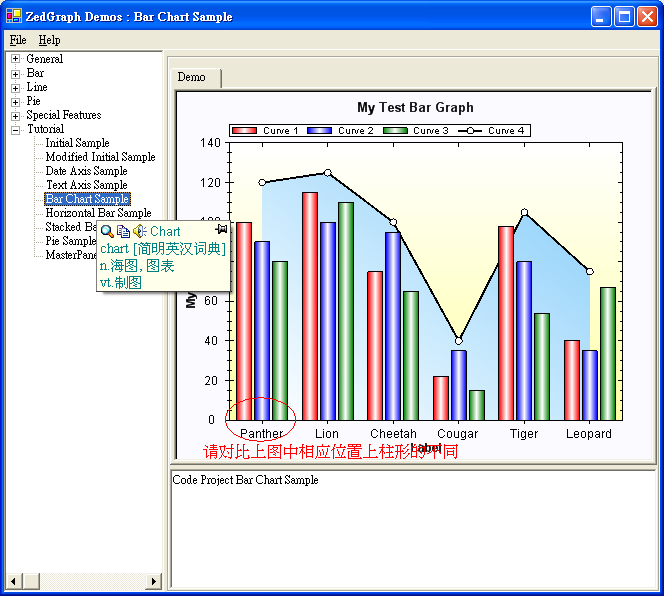
對比圖:IsTicsBetweenLabels = false 時柱子居中於刻度
public class BarChartSampleDemo : DemoBase
{
    public BarChartSampleDemo() : base("Code Project Bar Chart Sample", "Bar Chart Sample", DemoType.Tutorial)
    {
        GraphPane myPane = base.GraphPane;

        // 1. 標題與軸標籤
        myPane.Title = "My Test Bar Graph";
        myPane.XAxis.Title = "Label";
        myPane.YAxis.Title = "My Y Axis";

        // 2. 準備資料:6 個類別,4 組數值
        string[] labels = { "Panther", "Lion", "Cheetah", "Cougar", "Tiger", "Leopard" };
        double[] y  = { 100, 115, 75, 22, 98, 40 };
        double[] y2 = { 90, 100, 95, 35, 80, 35 };
        double[] y3 = { 80, 110, 65, 15, 54, 67 };
        double[] y4 = { 120, 125, 100, 40, 105, 75 }; // 折線圖資料

        // 3. 新增三組柱狀圖 (BarItem)
        BarItem myBar = myPane.AddBar("Curve 1", null, y, Color.Red);
        myBar.Bar.Fill = new Fill(Color.Red, Color.White, Color.Red); // 紅-白-紅 3D 漸層

        myBar = myPane.AddBar("Curve 2", null, y2, Color.Blue);
        myBar.Bar.Fill = new Fill(Color.Blue, Color.White, Color.Blue);

        myBar = myPane.AddBar("Curve 3", null, y3, Color.Green);
        myBar.Bar.Fill = new Fill(Color.Green, Color.White, Color.Green);

        // 4. 新增一組折線圖 (LineItem) 對比
        LineItem myCurve = myPane.AddCurve("Curve 4", null, y4, Color.Black, SymbolType.Circle);
        myCurve.Line.Fill = new Fill(Color.White, Color.LightSkyBlue, -45F); // 線條漸層
        myCurve.Symbol.Size = 8.0F;
        myCurve.Symbol.Fill = new Fill(Color.White);
        myCurve.Line.Width = 2.0F;

        // 5. X軸關鍵設定:文字類型 + 刻度位於標籤之間
        myPane.XAxis.IsTicsBetweenLabels = true;  // 關鍵:柱子置於刻度間,非居中
        myPane.XAxis.TextLabels = labels;         // 設定類別標籤
        myPane.XAxis.Type = AxisType.Text;        // 必須設為 Text 類型

        // 6. 背景填充美化
        myPane.AxisFill = new Fill(Color.White, Color.FromArgb(255, 255, 166), 90F); // 軸區漸層
        myPane.PaneFill = new Fill(Color.FromArgb(250, 250, 255));                   // 圖表區淡灰白

        base.ZedGraphControl.AxisChange();
    }
}
System.Object
  └─ ZedGraph.CurveItem
        └─ ZedGraph.BarItem
CurveItem:封裝單條曲線/數據系列的通用屬性(Key、Color、Symbol、LineStyle 等)。BarItem:專門針對柱狀圖擴展,新增 Bar 屬性(型別 Bar),控制柱寬、邊框、填充、3D 效果等。Pane.AddBar 隱式調用)| 簽名 | 說明 |
|---|---|
BarItem(string label) | 僅指定圖例文字,數據稍後賦值 |
BarItem(string label, double[] x, double[] y, Color color) | 完整指定:標籤、X值陣列、Y值陣列、顏色 |
實務上多用 myPane.AddBar(label, x, y, color),返回 BarItem 參考以便後續微調 Bar.Fill、Bar.Border 等。
new Fill(Color c1, Color c2, float angle):雙色線性漸層。
new Fill(Color c1, Color c2, Color c3, float angle):三色線性漸層(如紅-白-紅產生 3D 凸起感)。
angle:漸層角度(度),0 為水平,90 為垂直,負值反向。
myPane.XAxis.Type = AxisType.Text;           // 1. 聲明軸類型為文字
myPane.XAxis.TextLabels = labels;            // 2. 提供標籤陣列
myPane.XAxis.IsTicsBetweenLabels = true;     // 3. 刻度線位於標籤之間(柱子置中於區間)
IsTicsBetweenLabels = false):刻度線對準標籤中心,柱子中心對準刻度 → 柱子邊緣與標籤邊界對齊,視覺擁擠。PaneFill:整個 GraphPane 矩形區域背景(最外層)。AxisFill:座標軸矩形區域背景(內層,包含繪圖區)。同一 GraphPane 可任意混合 AddBar、AddCurve、AddPieSlice 等。折線圖常用於疊加趨勢線、目標線、移動平均線等輔助分析。
AxisType.Text + TextLabels + IsTicsBetweenLabels=true,缺一不可。(label, x, y, color),x 通常傳 null 自動生成 0..N;水平圖見第六節 BarBase.Y 時 x 為數值、y 為 null。AddBar 的 label 直接顯示於 Legend,無需額外設定。掌握以上要點,即可輸出專業級分組柱狀圖。下一節將講解日期軸與文字軸專題。