本節合併講解 DateAxisSampleDemo.cs(日期軸)與 TextAxisSampleDemo.cs(文字軸)。兩者核心均在於 AxisType 枚舉的切換與對應資料結構的配合,是 ZedGraph 處理非數值型別座標軸的基石。
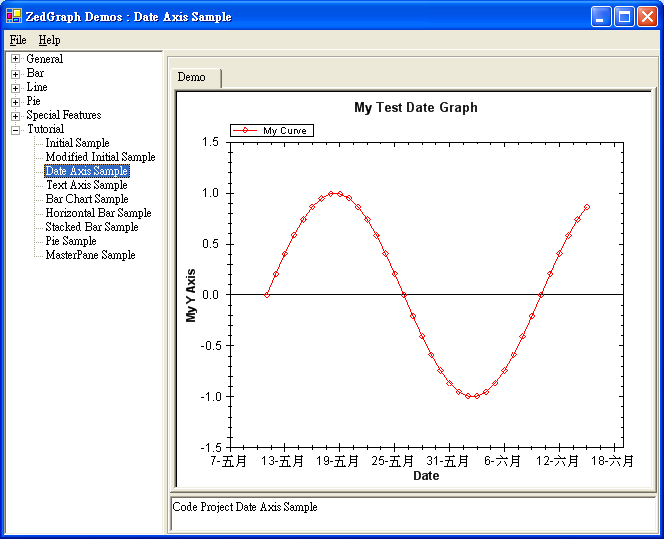
日期軸效果:
文字軸效果:
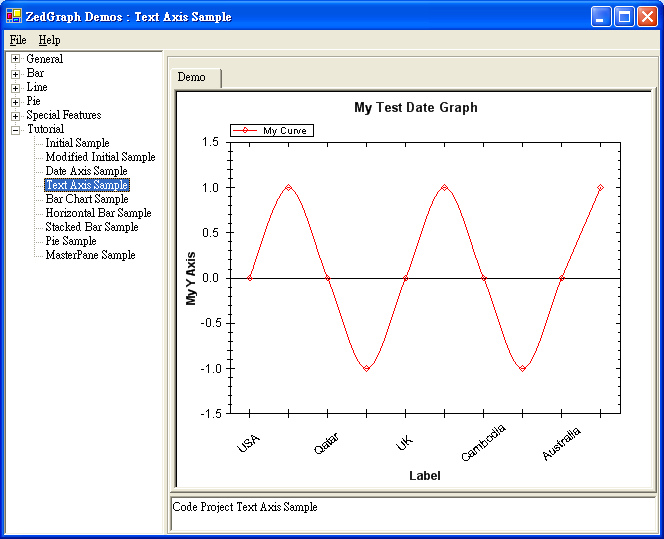
public class DateAxisSampleDemo : DemoBase
{
    public DateAxisSampleDemo() : base("Code Project Date Axis Sample", "Date Axis Sample", DemoType.Tutorial)
    {
        GraphPane myPane = base.GraphPane;
        myPane.Title = "My Test Date Graph";
        myPane.XAxis.Title = "Date";
        myPane.YAxis.Title = "My Y Axis";

        // 關鍵:使用 XDate 結構構建日期資料點
        PointPairList list = new PointPairList();
        for (int i = 0; i < 36; i++)
        {
            double x = (double)new XDate(1995, 5, i + 11); // XDate 隱式轉 double 為 XLDate 序列值
            double y = Math.Sin(i * Math.PI / 15.0);
            list.Add(x, y);
        }

        LineItem myCurve = myPane.AddCurve("My Curve", list, Color.Red, SymbolType.Diamond);

        // 核心一行:宣告 X 軸為日期類型
        myPane.XAxis.Type = AxisType.Date;

        base.ZedGraphControl.AxisChange();
    }
}
public class TextAxisSampleDemo : DemoBase
{
    public TextAxisSampleDemo() : base("Code Project Text Axis Sample", "Text Axis Sample", DemoType.Tutorial)
    {
        GraphPane myPane = base.GraphPane;
        myPane.Title = "My Test Text Graph";
        myPane.XAxis.Title = "Label";
        myPane.YAxis.Title = "My Y Axis";

        // 文字標籤陣列
        string[] labels = { "USA", "Spain\nMadrid", "Qatar", "Morocco", "UK", "Uganda",
                            "Cambodia", "Malaysia", "Australia", "Ecuador" };
        double[] y = new double[10];
        for (int i = 0; i < 10; i++)
            y[i] = Math.Sin(i * Math.PI / 2.0);

        // 文字軸需傳 null 作為 X 值陣列,由 TextLabels 提供位置
        LineItem myCurve = myPane.AddCurve("My Curve", null, y, Color.Red, SymbolType.Diamond);
        myCurve.Line.IsSmooth = true; // 啟用平滑曲線

        // 核心三部曲(同第五節柱狀圖)
        myPane.XAxis.Type = AxisType.Text;
        myPane.XAxis.TextLabels = labels;
        myPane.XAxis.ScaleFontSpec.Angle = 40; // 標籤傾斜 40 度防重疊

        base.ZedGraphControl.AxisChange();
    }
}
XDate(year, month, day)、XDate(year, month, day, hour, min, sec)、XDate(DateTime) 等多種重載。double x = (double)new XDate(...) 直接獲取 XLDate 序列值,供 PointPairList.Add 使用。| 枚舉值 | 適用資料類型 | 資料提供方式 | 自動格式化 |
|---|---|---|---|
AxisType.Linear | 數值(預設) | X/Y 皆為 double 陣列 | 科學計數法、固定小數位 |
AxisType.Log | 數值(對數) | X/Y 皆為 double 陣列 | 10^n 刻度標籤 |
AxisType.Text | 類別/文字 | X 為 null,TextLabels 提供字串陣列 | 直接顯示字串,支援換行、傾斜 |
AxisType.Date | 日期時間 | X 為 XLDate (double),Y 為 double | 自動依範圍切換 年/月/日/時/分 格式 |
AxisType.DateAsOrdinal | 日期(序數) | 同 Date | 忽略週末間隙,股市 K 線常用 |
文字軸標籤過長或過多時,設定 myPane.XAxis.ScaleFontSpec.Angle = 40; 即可傾斜顯示,完美解決重疊問題。配合 FontSpec.IsItalic、FontSpec.Size 可進一步優化閱讀體驗。
// 日期軸:X 值為 XLDate 數值
myPane.AddCurve(label, pointPairList, color, symbol);

// 文字軸:X 值為 null,位置由 TextLabels 決定
myPane.AddCurve(label, null, yValues, color, symbol);
myPane.XAxis.Scale.Format 強制指定格式(如 "yyyy/MM/dd")。\n 實現多行顯示(見範例 "Spain\nMadrid")。GraphPane 內不可混合 Date 與 Text 類型 X 軸,需拆分為多個 GraphPane(見第九節 MasterPane)。AxisType 後必須呼叫 AxisChange() 觸發重新計算軸範圍與標籤佈局。XDate + AxisType.Date 解決了時間序列視覺化的核心難題;AxisType.Text + TextLabels + ScaleFontSpec.Angle 則是類別資料呈現的標準範式。這兩節內容雖簡短,卻是後續所有業務圖表開發的基石。下一節進入第二節:修改版初始範例,引入網格線、圖例定位、區域填充、文字與箭頭標註等進階裝飾元素。