本節合併講解 HorizontalBarSampleDemo.cs(水平柱狀圖)與 StackedBarSampleDemo.cs(堆疊柱狀圖)。兩者本質相同,核心差異在於基軸方向(BarBase)與柱狀圖堆疊模式(BarType)。我們將通過兩個完整範例,系統梳理這兩大核心屬性的枚舉值、視覺效果與適用場景。
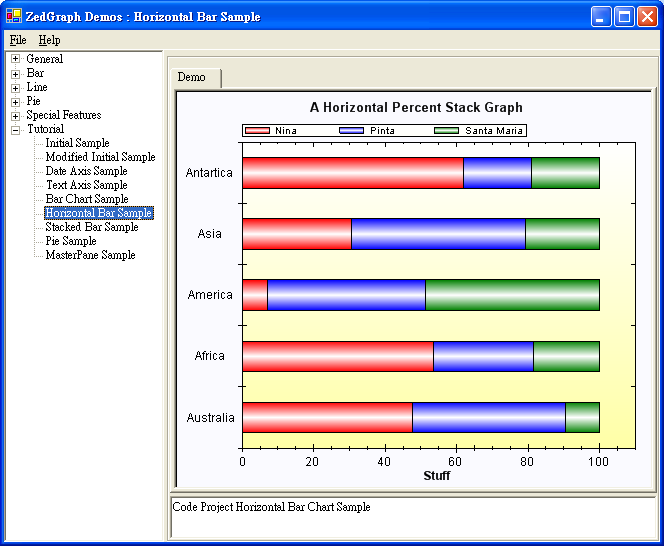
// 核心設定:Y軸為基軸 → 水平柱狀圖
myPane.BarBase = BarBase.Y;

// 核心設定:百分比堆疊模式
myPane.BarType = BarType.PercentStack;

// Y軸使用文字標籤
myPane.YAxis.Type = AxisType.Text;
myPane.YAxis.TextLabels = new string[] { "Australia", "Africa", "America", "Asia", "Antartica" };
myPane.YAxis.IsTicsBetweenLabels = true; // 刻度線位於標籤之間

// 資料陣列
double[] y  = { 100, 115, 15, 22, 98 };
double[] y2 = { 90, 60, 95, 35, 30 };
double[] y3 = { 20, 40, 105, 15, 30 };

// 新增三組柱狀資料(AddBar 簽名:label, x, y, color;水平圖中 x 為 null)
BarItem myCurve = myPane.AddBar("Nina", y, null, Color.Red);
myCurve.Bar.Fill = new Fill(Color.Red, Color.White, Color.Red, 90F); // 3D 漸層
// ... 同理新增 Pinta、Santa Maria
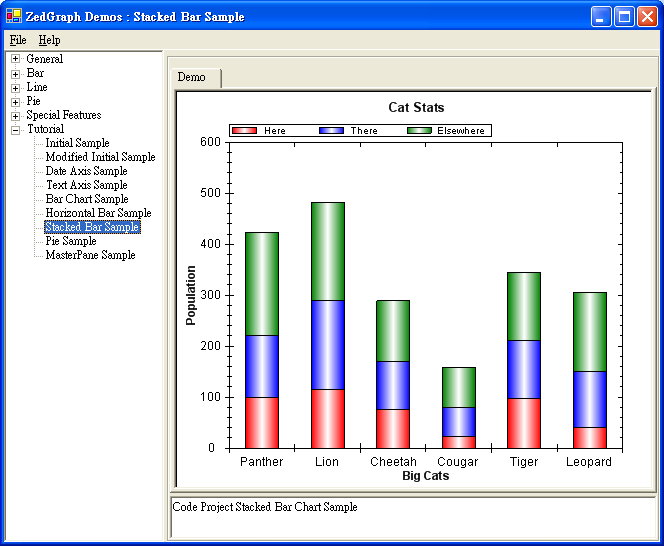
// 預設 BarBase = BarBase.X(垂直柱狀圖),無需額外設定
myPane.BarType = BarType.Stack; // 絕對值堆疊

// X軸文字標籤
myPane.XAxis.Type = AxisType.Text;
myPane.XAxis.TextLabels = new string[] { "Panther", "Lion", "Cheetah", "Cougar", "Tiger", "Leopard" };
myPane.XAxis.IsTicsBetweenLabels = true;

// 資料:y, y2, y3 直接疊加
double[] y  = { 100, 115, 75, 22, 98, 40 };
double[] y2 = { 120, 175, 95, 57, 113, 110 };
double[] y3 = { 204, 192, 119, 80, 134, 156 };

// AddBar 簽名:label, x, y, color;垂直圖中 y 為數值陣列
BarItem myCurve = myPane.AddBar("Here", null, y, Color.Red);
myCurve.Bar.Fill = new Fill(Color.Red, Color.White, Color.Red); // 3D 漸層
// ... 同理新增 There、Elsewhere
| 枚舉值 | 方向 | 適用場景 |
|---|---|---|
BarBase.X | 垂直(柱子沿 Y 軸向上生長) | 預設值,適合時間序列、類別比較 |
BarBase.Y | 水平(柱子沿 X 軸向右生長) | 類別標籤較長、需顯示大量類別、條形圖習慣 |
切換極簡單:myPane.BarBase = BarBase.Y; 即可在垂直/水平間無縫轉換,資料結構無需變動。
| 枚舉值 | 視覺效果 | 數據關係 | 典型應用 |
|---|---|---|---|
Cluster | 同類別並排分組 | 獨立數值 | 多系列對比(如各季度多產品銷量) |
ClusterHiLow | 分組 + 高低範圍 | 使用 IPointList.Z 定義底部 | 區間圖、誤差範圍、股價高低 |
Overlay | 按繪製順序覆蓋(先畫在上) | 獨立數值,視覺遮蓋 | 重疊分布對比、透明度疊加 |
SortedOverlay | 按數值大小排序覆蓋(小在上) | 獨立數值,自動排序 | 確保小數值不被大數值完全遮蓋 |
Stack | 絕對值累加堆疊 | 下一系列值 = 前序列值 + 當前值 | 總量與構成分析(如總銷售額分解) |
PercentStack | 百分比堆疊(每組總和=100%) | 各系列值轉換為百分比再堆疊 | 結構佔比趨勢(如市場份額變化) |
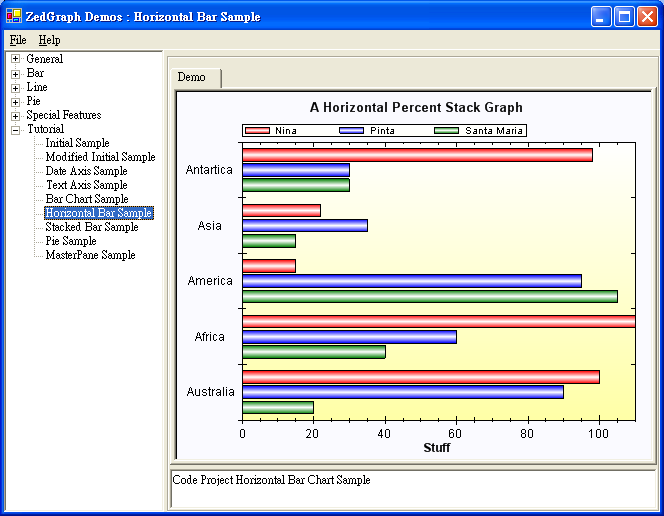
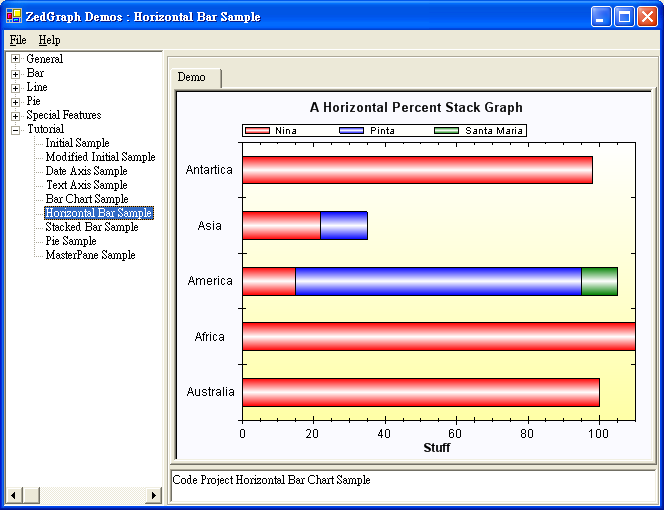
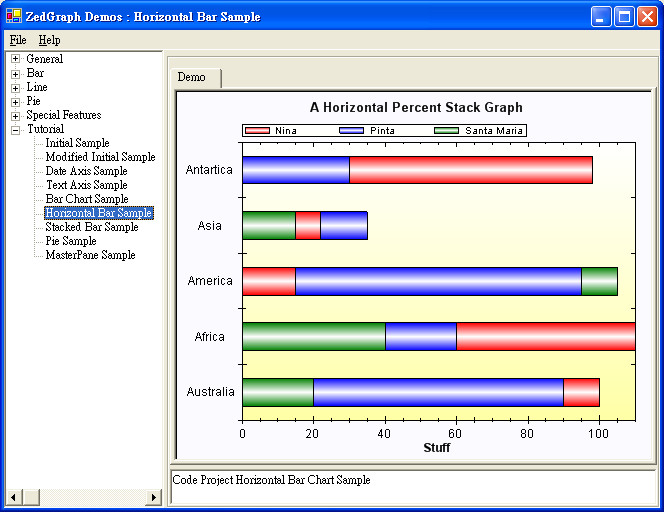
// 假設同一類別下兩系列值:(0, 100) 與 (0, 120)

// Stack 模式:
// 系列1 頂點 = 100
// 系列2 底部 = 100,頂點 = 100 + 120 = 220

// PercentStack 模式:
// 總和 = 220
// 系列1 百分比 = 100/220 ≈ 45.5%
// 系列2 百分比 = 120/220 ≈ 54.5%
// 視覺高度按百分比分配,總高度恆定(100%)
BarBase.Y。Stack/PercentStack;關注「系列間獨立對比」用 Cluster。SortedOverlay 可避免小數值被遮蓋。myCurve.Bar.Fill = new Fill(Color.Base, Color.White, Color.Base, angle); 顯著提升專業度。BarBase 與 BarType 是 ZedGraph 柱狀圖靈活性的基石。前者決定幾何朝向,後者定義數據關係視覺化邏輯。掌握六大 BarType 模式的數學含義與視覺語義,能讓你在儀表板設計中精準選型,避免「為了堆疊而堆疊」的誤區。下一節將進入基礎柱狀圖 BarChartSampleDemo 的細節講解。