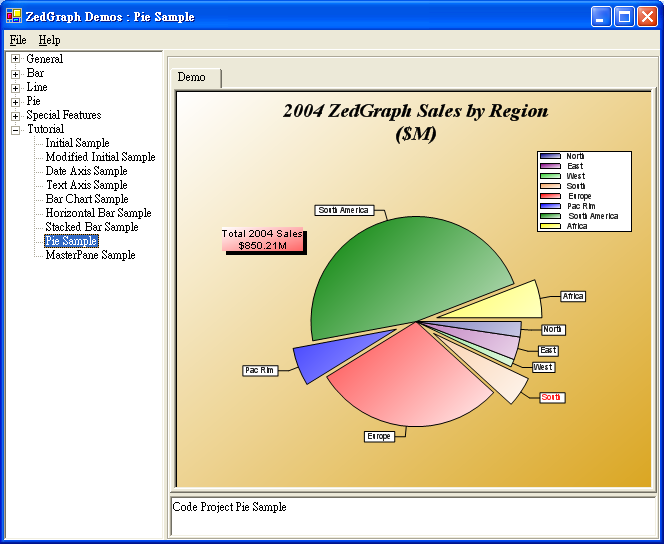
餅圖是商業報表中展示「部分佔整體比例」最直觀的圖表類型。ZedGraph 通過 PieItem 類別提供了豐富的餅圖切片自定義能力:漸層填充、切片離心、標籤樣式、圖例佈局等。本節結合 PieSampleDemo.cs,全方位解析餅圖構建要點。
public class PieSampleDemo : DemoBase
{
    public PieSampleDemo() : base("Code Project Pie Sample", "Pie Sample", DemoType.Pie, DemoType.Tutorial)
    {
        GraphPane myPane = base.GraphPane;

        // 1. 圖表標題樣式
        myPane.Title = "2004 ZedGraph Sales by Region ($M)";
        myPane.FontSpec.IsItalic = true;
        myPane.FontSpec.Size = 24f;
        myPane.FontSpec.Family = "Times";

        // 2. 背景漸層與軸區透明
        myPane.PaneFill = new Fill(Color.White, Color.Goldenrod, 45.0f);
        myPane.AxisFill.Type = FillType.None; // 餅圖無座標軸,隱藏軸背景

        // 3. 圖例浮動定位(關鍵:Position=Float 時 Location 才生效)
        myPane.Legend.Position = LegendPos.Float;
        myPane.Legend.Location = new Location(0.95f, 0.15f, CoordType.PaneFraction, AlignH.Right, AlignV.Top);
        myPane.Legend.FontSpec.Size = 10f;
        myPane.Legend.IsHStack = false; // 垂直堆疊圖例項目

        // 4. 新增餅圖切片:AddPieSlice 參數詳解
        // (數值, 漸層色1, 漸層色2, 漸層角度, 離心距離, 標籤文字)
        PieItem segment1 = myPane.AddPieSlice(20, Color.Navy, Color.White, 45f, 0, "North");
        PieItem segment3 = myPane.AddPieSlice(30, Color.Purple, Color.White, 45f, 0, "East");
        PieItem segment4 = myPane.AddPieSlice(10.21, Color.LimeGreen, Color.White, 45f, 0, "West");
        PieItem segment2 = myPane.AddPieSlice(40, Color.SandyBrown, Color.White, 45f, 0.2, "South"); // 離心 0.2
        PieItem segment6 = myPane.AddPieSlice(250, Color.Red, Color.White, 45f, 0, "Europe");
        PieItem segment7 = myPane.AddPieSlice(50, Color.Blue, Color.White, 45f, 0.2, "Pac Rim");
        PieItem segment8 = myPane.AddPieSlice(400, Color.Green, Color.White, 45f, 0, "South America");
        PieItem segment9 = myPane.AddPieSlice(50, Color.Yellow, Color.White, 45f, 0.2, "Africa");

        // 5. 單獨設定某一切片標籤顏色
        segment2.LabelDetail.FontSpec.FontColor = Color.Red;

        // 6. 計算總計並動態生成總額標註(含陰影效果)
        CurveList curves = myPane.CurveList;
        double total = 0;
        for (int x = 0; x < curves.Count; x++)
            total += ((PieItem)curves[x]).Value;

        TextItem text = new TextItem("Total 2004 Sales\n$" + total + "M", 0.18F, 0.40F, CoordType.PaneFraction);
        text.Location.AlignH = AlignH.Center;
        text.Location.AlignV = AlignV.Bottom;
        text.FontSpec.Border.IsVisible = false;
        text.FontSpec.Fill = new Fill(Color.White, Color.FromArgb(255, 100, 100), 45F);
        text.FontSpec.StringAlignment = StringAlignment.Center;
        myPane.GraphItemList.Add(text);

        // 陰影文字(偏移 0.008, 0.01,純黑填充)
        TextItem text2 = new TextItem(text);
        text2.FontSpec.Fill = new Fill(Color.Black);
        text2.Location.X += 0.008f;
        text2.Location.Y += 0.01f;
        myPane.GraphItemList.Add(text2);

        base.ZedGraphControl.AxisChange();
    }
}
Location 屬性生效。new Location(x, y, CoordType, AlignH, AlignV),支援 PaneFraction(相對圖表區比例)、AxisFraction(相對座標軸比例)、ChartFraction 等座標系。true 為水平排列圖例項,false 為垂直排列(預設)。AddPieSlice 重載最完整簽名:
PieItem AddPieSlice(double value, Color color1, Color color2, float angle, float displacement, string label)
| 參數 | 含義 | 備註 |
|---|---|---|
value | 切片數值(決定角度佔比) | 總和為所有切片 Value 之和 |
color1, color2 | 漸層起始/結束顏色 | 若色同則為純色填充 |
angle | 漸層方向角度 | 度數,0~360 |
displacement | 離心距離(0~1) | 0 為貼心,>0 產生「爆炸圖」效果 |
label | 切片標籤文字 | 自動關聯至圖例 |
CurveItem,擁有 Value 屬性,可動態修改數值即時更新切片角度,無需重建圖表。LabelDetail 屬性暴露標籤字體、顏色、位置等細節控制。Explode 屬性(布林)可一鍵切換離心狀態。myPane.CurveList 累加 PieItem.Value 獲取總計,體現資料驅動 UI 思想。TextItem + GraphItemList.Add 實現自由定位標註。TextItem,設定純黑填充,微調 Location.X/Y 偏移量,先加入陰影再加入主文字(或利用 ZOrder 控制層級)。ZedGraph 的餅圖功能雖不如專業報表控件豐富,但核心能力完備:漸層填充、離心效果、標籤微調、圖例自由佈局、動態數值更新。掌握 PieItem、LegendPos.Float 定位、TextItem 疊加陰影等技巧,即可輸出專業級商業餅圖。下一節將講解水平柱狀圖與堆疊柱狀圖。