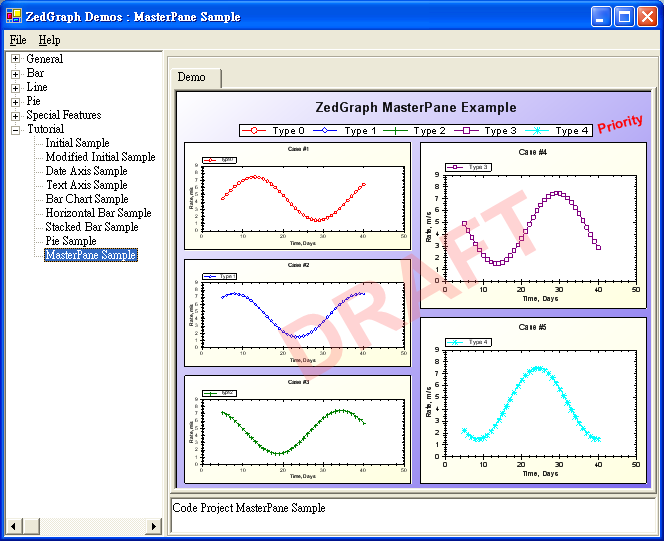
本系列教程進入第九節,我們將探討 ZedGraph 中極具威力的 MasterPane 類別。它是實現多圖表佈局、儀表板式報表及複合視覺化的核心容器。本節將結合 MasterSampleDemo.cs 原始碼,詳細剖析 MasterPane、ColorSymbolRotator 及 ZOrder 三大關鍵知識點。
public class MasterSampleDemo : DemoBase
{
    public MasterSampleDemo() : base("Code Project MasterPane Sample", "MasterPane Sample", DemoType.Tutorial)
    {
        MasterPane myMaster = base.MasterPane;

        // 1. 清除預設 GraphPane
        myMaster.PaneList.Clear();

        // 2. 設定 MasterPane 標題與背景漸層
        myMaster.Title = "ZedGraph MasterPane Example";
        myMaster.IsShowTitle = true;
        myMaster.PaneFill = new Fill(Color.White, Color.MediumSlateBlue, 45.0F);
        myMaster.MarginAll = 10;

        // 3. 啟用並配置圖例
        myMaster.Legend.IsVisible = true;
        myMaster.Legend.Position = LegendPos.TopCenter;

        // 4. 新增文字標註:Priority 標籤
        TextItem text = new TextItem("Priority", 0.88F, 0.12F);
        text.Location.CoordinateFrame = CoordType.PaneFraction;
        text.FontSpec.Angle = 15.0F;
        text.FontSpec.FontColor = Color.Red;
        text.FontSpec.IsBold = true;
        text.FontSpec.Size = 15;
        text.FontSpec.Border.IsVisible = false;
        text.FontSpec.Fill.IsVisible = false;
        text.Location.AlignH = AlignH.Left;
        text.Location.AlignV = AlignV.Bottom;
        myMaster.GraphItemList.Add(text);

        // 5. 新增水印:DRAFT(利用 ZOrder 置頂)
        text = new TextItem("DRAFT", 0.5F, 0.5F);
        text.Location.CoordinateFrame = CoordType.PaneFraction;
        text.FontSpec.Angle = 30.0F;
        text.FontSpec.FontColor = Color.FromArgb(70, 255, 100, 100); // 半透明紅
        text.FontSpec.IsBold = true;
        text.FontSpec.Size = 100;
        text.FontSpec.Border.IsVisible = false;
        text.FontSpec.Fill.IsVisible = false;
        text.Location.AlignH = AlignH.Center;
        text.Location.AlignV = AlignV.Center;
        text.ZOrder = ZOrder.A_InFront; // 關鍵:置於所有圖層最前
        myMaster.GraphItemList.Add(text);

        // 6. 顏色/符號旋轉器:為多條曲線自動分配風格
        ColorSymbolRotator rotator = new ColorSymbolRotator();

        // 7. 批量建立 5 個 GraphPane 並加入 MasterPane
        for (int j = 0; j < 5; j++)
        {
            GraphPane myPane = new GraphPane(new Rectangle(10, 10, 10, 10),
                "Case #" + (j + 1), "Time, Days", "Rate, m/s");

            myPane.PaneFill = new Fill(Color.White, Color.LightYellow, 45.0F);
            myPane.BaseDimension = 6.0F;

            // 產生正弦波測試資料
            PointPairList list = new PointPairList();
            for (int i = 0; i < 36; i++)
            {
                double x = i + 5;
                double y = 3.0 * (1.5 + Math.Sin(i * 0.2 + j));
                list.Add(x, y);
            }

            // 新增曲線,自動取得下一組顏色/符號
            LineItem myCurve = myPane.AddCurve("Type " + j, list,
                rotator.NextColor, rotator.NextSymbol);
            myCurve.Symbol.Fill = new Fill(Color.White); // 符號填白避免遮擋

            myMaster.Add(myPane);
        }

        // 8. 自動佈局與軸縮放
        Graphics g = this.ZedGraphControl.CreateGraphics();
        myMaster.AutoPaneLayout(g, PaneLayout.ExplicitRow32); // 3行2列佈局
        myMaster.AxisChange(g);
        g.Dispose();
    }
}
PaneBase,內部維護 PaneList 集合,管理多個 GraphPane 實例。Add(GraphPane) / PaneList:增刪改查子圖表。AutoPaneLayout(Graphics, PaneLayout):自動計算子圖表位置與大小(支援 RowCol、ExplicitRow 等多種佈局枚舉)。AxisChange(Graphics):統一觸發所有子圖表的軸範圍重算。GraphItemList:掛載跨越整個 MasterPane 的註釋、水印、圖形等裝飾元素。PaneLayout.Single、RowCol、ExplicitRow32(3行2列)、ExplicitRow23 等,滿足各類儀表板排版需求。NextColor、NextSymbol),避免手動硬編碼顏色導致視覺衝突。ZOrder 決定 GraphItem(文字、箭頭、圖片等裝飾元素)在繪製時的前後遮蓋關係。若將水印視為「浮在圖表之上」或「沉在背景之中」,全靠此屬性。
| 枚舉值 | 層級描述 | 典型應用 |
|---|---|---|
G_BehindAll | 最底層,甚至在標題之後 | 全域背景水印 |
F_BehindAxisFill | 座標軸背景填充之後 | 軸區背景裝飾 |
E_BehindAxis | 座標軸物件之後 | 網格線增強 |
D_BehindCurves | 曲線/柱狀圖之後 | 資料區背景標註 |
C_BehindAxisBorder | 座標軸邊框之後 | 邊框內側裝飾 |
B_BehindLegend | 圖例之後 | 圖例背景強調 |
A_InFront | 最前層(同層級按 GraphItemList 順序) | 水印、關鍵標註、浮動工具提示 |
text.ZOrder = ZOrder.A_InFront → "DRAFT" 浮於所有子圖表之上(示例效果)。text.ZOrder = ZOrder.G_BehindAll → "DRAFT" 沉入最底層,被所有子圖表遮蓋。MasterPane 將 ZedGraph 從「單圖表繪製庫」昇級為「多圖表佈局引擎」。配合 AutoPaneLayout、ColorSymbolRotator、ZOrder 等進階特性,開發者可快速構建專業級儀表板、多頁報表預覽、對比分析視圖等複雜視覺化應用。下一節將進入專題進階篇,敬請期待。