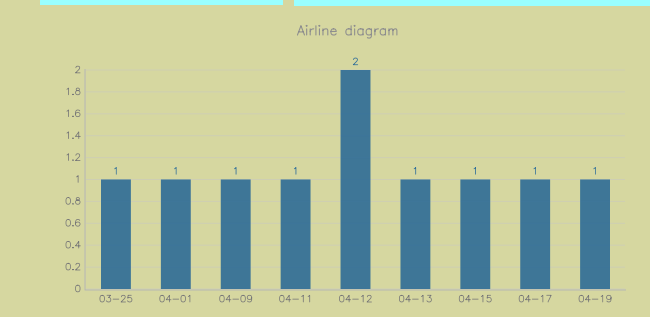
SQL:最近 30 天每日統計
SELECT DATE_FORMAT(boo_time,'%m-%d') AS day, COUNT(boo_autoid) AS cnt
FROM bookinformation
WHERE flag_pass=0
  AND DATE_SUB(NOW(), INTERVAL 30 DAY) <= DATE(boo_time)
GROUP BY DATE_FORMAT(boo_time,'%m %d');
Action (IndexController)
public function indexAction() {
    $db = new Application_Model_DbTable_Flightinformation();
    $sql = "SELECT DATE_FORMAT(boo_time,'%m-%d') AS day, COUNT(boo_autoid) AS cnt
            FROM bookinformation
            WHERE flag_pass=0 AND DATE_SUB(NOW(), INTERVAL 30 DAY) <= DATE(boo_time)
            GROUP BY DATE_FORMAT(boo_time,'%m %d')";
    $this->view->result = $db->getAllInfo($sql)->fetchAll();
}
Model (Flightinformation)
class Application_Model_DbTable_Flightinformation extends Zend_Db_Table_Abstract {
    protected $_name = 'flightinformation';
    public function getAllInfo($sql) {
        return Zend_Registry::get('db')->query($sql);
    }
}
View (dirgramshow.phtml) - JSChart 渲染
<div id="graph">Loading...</div>
<script src="jquery.js"></script>
<script src="ZJPjscharts.js"></script>
<script>
var d=[], color=[];
<?php foreach($this->result as $v): ?>
d.push(['<?=$v['day']?>', <?=$v['cnt']?>]);
color.push('#2D6B96');
<?php endforeach; ?>
if(d.length){
    var chart = new JSChart('graph','bar');
    chart.setDataArray(d);
    chart.colorizeBars(color);
    chart.setTitle('Airline diagram');
    chart.draw();
}
</script>
效果