Health Center 是 IBM 提供的免費低開銷 Java 監控診斷工具與 API,運行於 IBM JVM 之上。承接第 1 部分的死鎖偵測應用,本文將新增方法分析視圖,展示應用程式消耗最多 CPU 週期的程式碼路徑。
GenerateDeadlock 新增 CPU 密集型邏輯:SlowClassAndMethod1(字串連接)與 SlowClassAndMethod2(HashMap 操作)啟動命令(Java 5 SR10+/6 SR5+/7):
java -Xhealthcenter GenerateDeadlock
private void analyzeMethods() {
    ProfilingData profilingData = hcMon.getProfilingData();
    if (profilingData == null) return;

    MethodProfileData[] mPD = profilingData.getProfilingEvents();
    if (mPD != null) {
        SimpleProfileData[] sPD = new SimpleProfileData[mPD.length];
        int index = 0;
        for (MethodProfileData mP : mPD) {
            methodTree = new String();
            sPD[index] = new SimpleProfileData();
            sPD[index].setCount(mP.getMethodSampleCount());
            sPD[index].setMethodName(mP.getMethodName());

            // 遞迴建構調用樹
            MethodProfilingNode[] mPN = mP.getCallingMethods();
            for (MethodProfilingNode node : mPN) {
                if (node instanceof MethodProfilingNode) {
                    walkProfileTree(node);
                }
            }
            sPD[index].setMethodTree(methodTree);
            index++;
        }
        Arrays.sort(sPD); // 依樣本計數排序

        // UI 更新顯示熱點方法
        display.asyncExec(() -> {
            profileText.setText("method: " + sPD[0].getMethodName() +
                "\n sample count: " + sPD[0].getCount() + "\n" +
                sPD[0].getMethodName() + sPD[0].getMethodTree());
            shell.redraw();
        });
    }
}
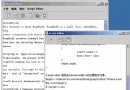
getProfilingEvents():返回 MethodProfileData 陣列getMethodSampleCount():取得採樣計數getMethodName():取得方法名稱getCallingMethods():取得調用該方法的節點陣列(調用堆疊)採樣計數反映方法相對佔用 CPU 多寡。頂部面板顯示最高計數方法,例如 java.util.HashMap.rehash(int),調用堆疊追溯至 GenerateDeadlock$runSlowMethods$SlowClassAndMethod2.run() → slowMethod2() → HashMap.put() → rehash()。
slowMethod2() 中百萬次迴圈執行 map.put() 導致頻繁擴容:
private void slowMethod2() {
    HashMap map = new HashMap();
    String largeString = new String("another string to add");
    for (int i = 0; i < 1000000; i++) {
        map.put(i, largeString);
        largeString.concat(largeString);
    }
}
註解掉迴圈後重新執行,分析面板顯示新熱點方法,確認問題解決。此過程可反覆迭代,持續優化效能瓶頸。
Health Center API 提供豐富診斷數據存取能力,開發者可構建客製化監控工具。結合死鎖偵測與方法分析,能全面掌握應用運行狀態,快速定位並解決效能問題。