資訊系統常需資料統計與圖表展示。早期手繪座標軸效果差、維護難。VS2008 內建圖表組件需安裝且僅支援 .NET 3.5。發現 dotnetCHARTING 僅需引用單一 dotnetCHARTING.dll,支援 .NET 1.1~3.5,官網近千種圖表樣式涵蓋所有報表需求。
public string PhaysicalImagePath { get; set; }  // 圖片存放路徑
public string Title { get; set; }               // 圖表標題
public string XTitle { get; set; }              // X軸名稱
public string YTitle { get; set; }              // Y軸名稱
public string SeriesName { get; set; }          // 圖例名稱
public int PicWidth { get; set; }               // 圖片寬度
public int PicHight { get; set; }               // 圖片高度
public SeriesType Type { get; set; }            // 圖表類型(柱狀/折線等)
public bool Use3D { get; set; }                 // 是否3D效果
public SeriesCollection DataSource { get; set; } // 對比圖資料源
public string FileName { get; set; }            // 輸出檔名
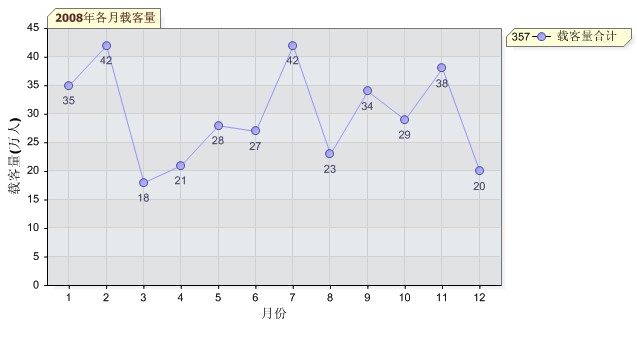
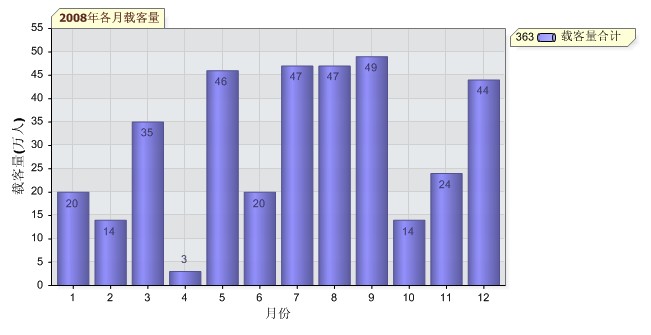
資料源僅需 DataTable(兩欄:X軸值、Y軸值),元件自動分配 Y 軸刻度:
private DataTable GetDataSource() {
    // SQL: select month, count from table where ...
    return db.RetDataTable(sql);
}
繪圖調用:
private void Drawing() {
    Charting c = new Charting();
    c.Title = "2008年各月載客量";
    c.XTitle = "月份"; c.YTitle = "載客量(萬人)";
    c.PicHight = 350; c.PicWidth = 650;
    c.SeriesName = "合計";  // 僅DataTable源有效
    c.PhaysicalImagePath = "ChartImages";  // 必須存在對應資料夾
    c.FileName = "Statistics";
    c.Type = SeriesType.Line;  // 折線型
    c.Use3D = false;
    c.DataSource = GetDataSource();
    c.CreateStatisticPic(this.Chart1);
}

public void CreateStatisticPic(dotnetCHARTING.Chart chart) {
    chart.Title = this.Title;
    chart.XAxis.Label.Text = this.XTitle;
    chart.YAxis.Label.Text = this.YTitle;
    chart.TempDirectory = this.PhaysicalImagePath;
    chart.FileManager.FileName = this.FileName;
    chart.Width = this.PicWidth;
    chart.Height = this.PicHight;
    chart.Type = ChartType.Combo;
    chart.Series.Type = this.Type;
    chart.Series.Name = this.SeriesName;
    chart.Series.Data = this.DataSource;
    chart.SeriesCollection.Add();
    chart.DefaultSeries.DefaultElement.ShowValue = true;
    chart.ShadingEffect = true;
    chart.Use3D = this.Use3D;
    chart.Series.DefaultElement.ShowValue = true;
}
平面圖觀感優於 3D,檔名策略建議:UserID+報表編號 避免多用戶衝突,定期清理舊檔。
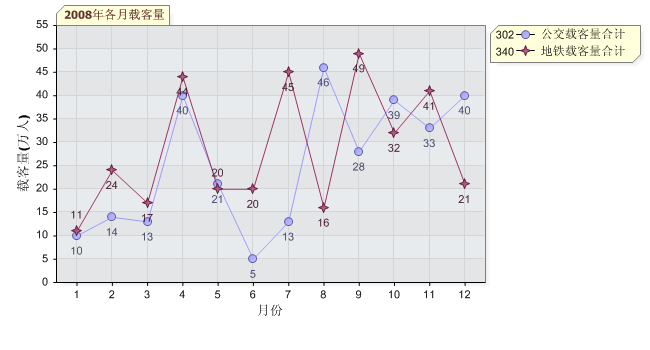
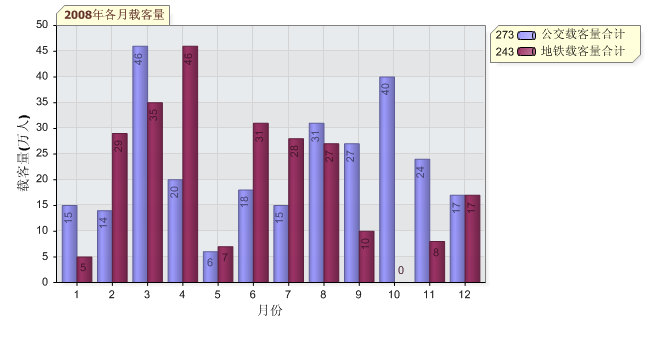
資料源需為 SeriesCollection 類型:
private SeriesCollection GetDataSource() {
    SeriesCollection SC = new SeriesCollection();
    Random rd = new Random();

    for (int a = 1; a <= 2; a++) {  // 兩個對比項
        Series s = new Series();
        s.Name = (a == 1 ? "公交載客量合計" : "地鐵載客量合計");
        for (int b = 1; b <= 12; b++) {  // 12個月
            Element e = new Element();
            e.Name = b.ToString();  // X軸刻度名稱
            e.YValue = rd.Next(50); // Y軸數值
            s.Elements.Add(e);
        }
        SC.Add(s);
    }
    // 可自訂顏色:SC[0].DefaultElement.Color = Color.Blue;
    return SC;
}

// 對比圖繪製關鍵差異:
chart.DefaultSeries.Type = this.Type;  // 統一使用預設序列類型
chart.SeriesCollection.Add(this.DataSource);  // 直接添加集合
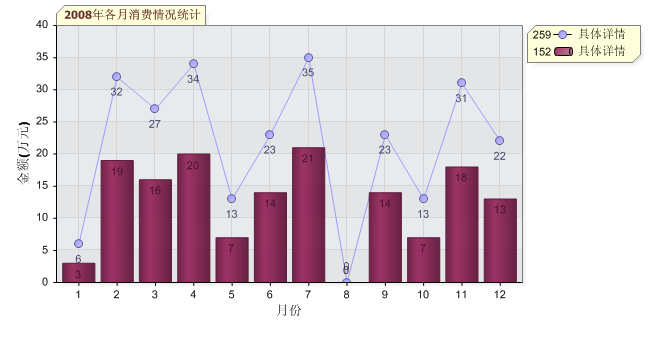
適用場景:左軸載客量、右軸發車次數,觀察發車量變化對載客量影響。官網範例 RateCharts 可參考實作。
免費版生成圖片含隱藏導航連結,可用 JS 移除 map 標籤(官方建議修改 IL 重編譯破解 DLL)。
總結:dotnetCHARTING 以單一 DLL、跨框架版本、豐富圖表類型、靈活 API 解決 .NET 統計圖開發痛點,強力推薦。