using System; using System.Collections.Generic; using System.Text;
using System.Drawing; using System.Data; using System.Drawing.Drawing2D;
namespace SarchPMS.Business.Draw {
    public class DrawingCurve : DrawingChart {
        public override Bitmap DrawImage(DataSet dsParameter) {
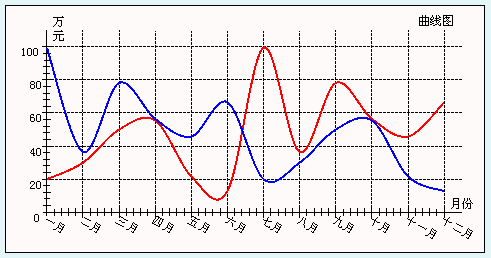
            Curve2D cuv2D = new Curve2D(); cuv2D.Fit(); return cuv2D.CreateImage();
        }
    }
    public class Curve2D {
        // ... 大量屬性:寬高、刻度、顏色、字體、張力係數、資料陣列 ...
        #region 公共屬性 (Width, Height, XSlice, YSlice, Title, Keys, Values, Colors, ...)
        // ... 省略重複屬性程式碼 ...
        #endregion

        public void Fit() {
            intFontSpace = FontSize + 5;
            float fltSpace = Math.Min(Width / 6, Height / 6);
            XSpace = fltSpace; YSpace = fltSpace;
            XSlice = (Width - 2 * XSpace) / (Keys.Length - 1);
            // 計算 Y 軸範圍與刻度
            float fltMinValue = 0, fltMaxValue = 0;
            foreach (float v in Values) {
                if (v < fltMinValue) fltMinValue = v;
                else if (v > fltMaxValue) fltMaxValue = v;
            }
            if (YSliceBegin > fltMinValue) YSliceBegin = fltMinValue;
            int intYSliceCount = (int)(fltMaxValue / YSliceValue);
            if (fltMaxValue % YSliceValue != 0) intYSliceCount++;
            YSlice = (Height - 2 * YSpace) / intYSliceCount;
        }

        public Bitmap CreateImage() {
            InitializeGraph();
            int intKeysCount = Keys.Length, intValuesCount = Values.Length;
            if (intValuesCount % intKeysCount == 0) {
                int intCurvesCount = intValuesCount / intKeysCount;
                for (int i = 0; i < intCurvesCount; i++) {
                    float[] fltCurrentValues = new float[intKeysCount];
                    for (int j = 0; j < intKeysCount; j++)
                        fltCurrentValues[j] = Values[i * intKeysCount + j];
                    DrawContent(ref objGraphics, fltCurrentValues, clrsCurveColors[i]);
                }
            } else {
                objGraphics.DrawString("錯誤:Values 長度必須是 Keys 整數倍!", ...);
            }
            return objBitmap;
        }
        // InitializeGraph, SetAxisText, SetXAxis, SetYAxis, DrawContent, CreateTitle 等私有繪圖方法 ...
    }
}
將上述程式碼複製至專案,呼叫 DrawImage 即可見效果。