本系列教程首節,從最基礎的 InitialSampleDemo.cs 切入,系統梳理 ZedGraph 核心類別繼承體系、DemoBase 基礎設施、PointPairList 資料結構、LineItem 曲線繪製流程,為後續所有進階主題奠定堅實基礎。
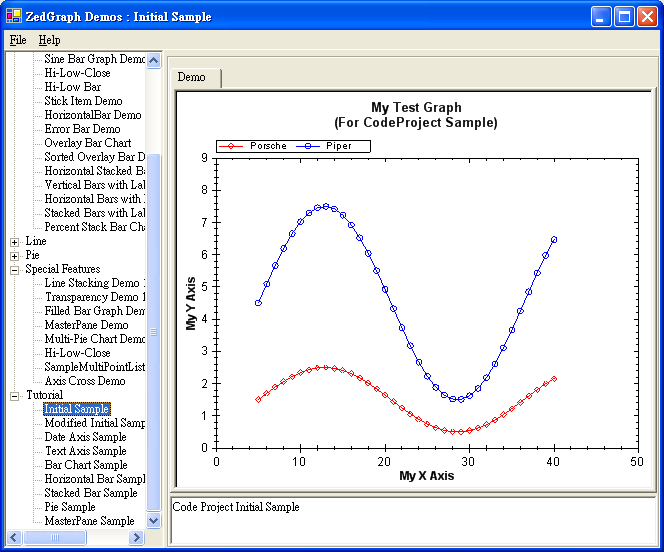
Demo 類別在樹狀導覽中的分類展示:
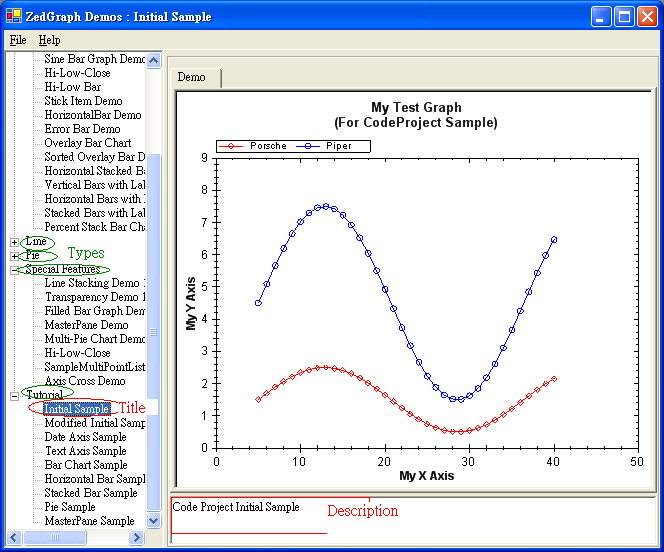
public class InitialSampleDemo : DemoBase
{
    public InitialSampleDemo() : base("Code Project Initial Sample", "Initial Sample", DemoType.Tutorial)
    {
        GraphPane myPane = base.GraphPane;

        // 1. 設定標題與軸標籤
        myPane.Title = "My Test Graph\n(For CodeProject Sample)";
        myPane.XAxis.Title = "My X Axis";
        myPane.YAxis.Title = "My Y Axis";

        // 2. 準備資料:PointPairList (X,Y 座標點集合)
        PointPairList list1 = new PointPairList();
        PointPairList list2 = new PointPairList();
        for (int i = 0; i < 36; i++)
        {
            double x = i + 5;
            double y1 = 1.5 + Math.Sin(i * 0.2);
            double y2 = 3.0 * (1.5 + Math.Sin(i * 0.2));
            list1.Add(x, y1);
            list2.Add(x, y2);
        }

        // 3. 新增兩條曲線
        LineItem myCurve = myPane.AddCurve("Porsche", list1, Color.Red, SymbolType.Diamond);
        LineItem myCurve2 = myPane.AddCurve("Piper", list2, Color.Blue, SymbolType.Circle);

        // 4. 觸發軸範圍重算與繪製
        base.ZedGraphControl.AxisChange();
    }
}
// 介面定義
public interface ZedGraphDemo
{
    string Description { get; }
    string Title { get; }
    ZedGraphControl ZedGraphControl { get; }
    ICollection Types { get; }
}

// 基礎實作類
public class DemoBase : ZedGraphDemo
{
    // 實現介面四大屬性
    // 額外提供:
    public GraphPane Pane { get; }        // 單圖表模式快捷屬性 → base.GraphPane
    public MasterPane MasterPane { get; } // 多圖表模式快捷屬性

    // 多載建構函數
    public DemoBase(string description, string title, DemoType type) { ... }
    public DemoBase(string description, string title, DemoType type1, DemoType type2) { ... }
    public DemoBase(string description, string title, ICollection types) { ... }

    private void Init(string description, string title, ICollection types)
    {
        this.description = description;
        this.title = title;
        this.types = types; // 決定出現在哪些樹狀節點下
        control = new ZedGraphControl(); // 核心控制項實例
    }
}

// 範例類
public class InitialSampleDemo : DemoBase { ... }
| 屬性 | 含義 | 用途 |
|---|---|---|
Description | 範例詳細描述 | 工具提示、文檔生成 |
Title | 樹狀導覽顯示標題 | 使用者介面選單文字 |
Types | 歸屬分類集合 (DemoType 枚舉) | 決定出現在「Tutorial」、「Special Features」等哪個節點下 |
ZedGraphControl | 核心繪圖控制項實例 | 提供 GraphPane、MasterPane、AxisChange() 等入口 |
Pane / GraphPane | 單圖表容器 | 最常用繪圖入口 |
MasterPane | 多圖表容器 | 第九節詳細講解 |
Object → CollectionBase → CollectionPlus → PointPairListPointPair (X, Y, Z(可選)) 的強型別集合。Add(x, y)、Add(pointPair)、索引器 [i]、Count。IPointList 介面,可直接傳遞給 AddCurve。
LineItem myCurve = myPane.AddCurve("Porsche", list1, Color.Red, SymbolType.Diamond);
label:圖例顯示文字("Porsche")。list:實作 IPointList 的資料來源(PointPairList、double[] 等)。color:曲線與符號主色調。symbol:SymbolType 枚舉 12 種形狀。LineItem 參考,可進一步設定 Line.Width、Symbol.Fill、Line.Fill 等精細屬性。Circle, Square, Diamond, Triangle, TriangleDown, Star, Plus, X, Dash, HDash, VDash, None
所有屬性變更(資料、標題、軸範圍、填充等)最終必須呼叫 base.ZedGraphControl.AxisChange() 才會生效。內部執行:軸範圍自動計算 → 刻度生成 → 圖例佈局 → 失效繪圖區 → 觸發 Paint 事件。
第一節建立了 ZedGraph 開發的最小認知閉環:
DemoBase → 獲得控制項與分類能力。GraphPane → 繪圖畫布。PointPairList → 載入資料。AddCurve → 產生視覺元素並獲取微調控制代碼。AxisChange() → 完成渲染。後續章節將在此骨架上疊加:
第 2 節:裝飾元素(網格、圖例、填充、標註)
第 3-4 節:座標軸類型(日期、文字)
第 5-7 節:柱狀圖變體(分組、堆疊、水平、百分比)
第 8 節:餅圖
第 9 節:MasterPane 多圖表佈局
進階篇:動態更新、滾動縮放、列印匯出、Web 部署等。