利用強大的 pChart 圖表庫,從資料庫讀取股票歷史數據,動態生成專業級 K 線趨勢圖與成交量柱狀圖,支援中英文切換、時間範圍篩選、自適應縮放等功能。
$type = $_GET['type'] ?? 'line';      // line|bar
$showTxt = ($_GET['txt'] ?? 0) == 1;
$lang = in_array($_GET['lang'] ?? '', ['cn','hk']) ? $_GET['lang'] : 'hk';
$id = (int)($_GET['id'] ?? 1);

$where = "WHERE stock_no = $id";
if (!empty($_GET['min'])) $where .= " AND created >= " . (int)$_GET['min'];
if (!empty($_GET['max'])) $where .= " AND created <= " . (int)$_GET['max'];
$where .= " ORDER BY created";

$sth = $dbh->prepare("SELECT * FROM $tb_name $where");
$sth->execute();
$results = $sth->fetchAll(PDO::FETCH_ASSOC);
foreach ($results as $k => $v) {
    $prices[] = $v['current_price'];
    $volumes[] = $v['volume'];
    // 僅每 4 個點顯示時間標籤,避免 X 軸擁擠
    $times[] = ($k % 4 === 0) ? $v['created'] : null;
}
$myData = new pData();
$myData->addPoints(array_fill(0, $count, 130), 'BaseLine'); // 昨日收盤價基準線
$myData->addPoints($prices, 'Price');
$myData->setPalette('BaseLine', ['R'=>51,'G'=>114,'B'=>178]);
$myData->setPalette('Price', ['R'=>0,'G'=>255,'B'=>0]);

$myData->addPoints($times, 'Time');
$myData->setAbscissa('Time');
$myData->setXAxisDisplay(AXIS_FORMAT_TIME, 'H:i');

$picture = new pImage(480, 300, $myData);
$picture->setGraphArea(10, 40, 440, 260);

// 手動設定 Y 軸範圍(最小-2 到 最大+2)
$picture->drawScale([
    'Mode' => SCALE_MODE_MANUAL,
    'ManualScale' => [0 => ['Min' => $minPrice-2, 'Max' => $maxPrice+2]],
    'GridR' => 200, 'GridG' => 200, 'GridB' => 200,
]);

$picture->drawLineChart();  // 繪製價格線
$myData->setSerieDrawable('BaseLine', false);
$picture->drawAreaChart(['ForceTransparency' => 15]); // 填充區域
$myData->addPoints($volumes, 'Volume');
$myData->setPalette('Volume', ['R'=>51,'G'=>114,'B'=>178]);
$picture = new pImage(480, 200, $myData);
$picture->setGraphArea(50, 20, 450, 180);
$picture->drawScale(['Mode' => SCALE_MODE_START0, 'GridR'=>200,'GridG'=>200,'GridB'=>200]);
$picture->drawBarChart();

// 總成交量圖例
$totalVol = array_sum($volumes);
$myData->setSerieDescription('Volume', "總成交量:$totalVol");
$picture->drawLegend(300, 9, ['Style'=>LEGEND_NOBORDER, 'Mode'=>LEGEND_HORIZONTAL]);
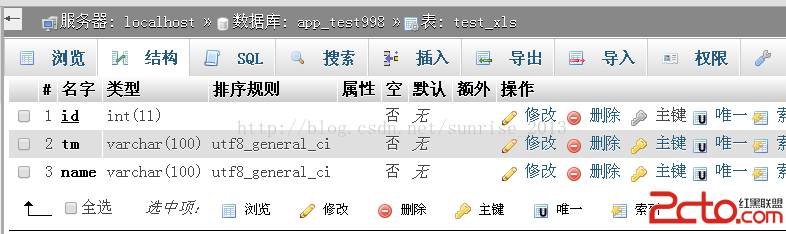
php-gd 擴展並確保 FreeType 支援fonts/zh_hk.ttc、fonts/zh_cn.ttf、fonts/en_us.ttf 需實際存在stock_no、current_price、volume、created 欄位