商業圖表庫功能強大但笨重、授權昂貴。利用 Java 面向物件特性,我們可以從零構建一個輕量、可擴展、易理解的圖表元件。本文將展示如何將圖表分解為核心元素,透過介面與抽象類定義契約,實現折線圖、長條圖、組合圖與即時繪圖。
| 類型 | 視覺特徵 | 典型用途 |
|---|---|---|
| 散點圖 | X-Y 座標點分佈 | 兩變數相關性分析(如:淬火溫度 vs 鋼硬度) |
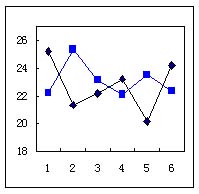
| 折線圖 | 點連成線 | 趨勢變化(如:每日銷售額) |
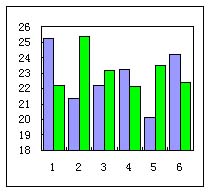
| 長條圖 | 矩形條高度代表數值 | 類別比較、離散資料 |
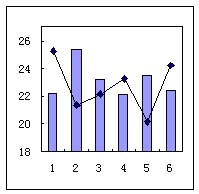
同一資料集可呈現為折線圖、長條圖、或兩者疊加(折線+長條),甚至包含負值長條。
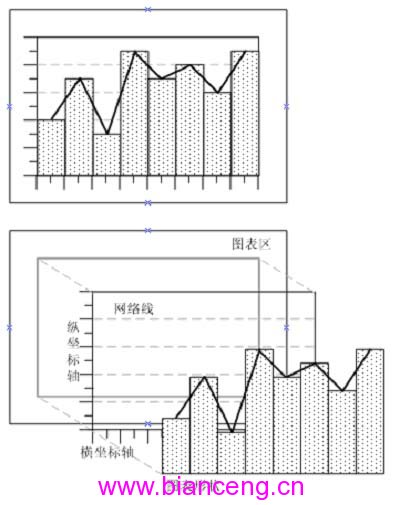
public interface ChartWidget {
    int getX(); int getY();
    int getWidth(); int getHeight();
    void draw(Graphics g);
}
public abstract class Scale {
    protected double min, max;       // 實際資料範圍
    protected int screenMin, screenMax; // 螢幕像素範圍

    public abstract int getScreenCoordinate(double value); // 實際值 → 像素

    public double getActualValue(int pixel) { // 像素 → 實際值
        double range = max - min;
        double ratio = (pixel - screenMin) / (double)(screenMax - screenMin);
        return min + ratio * range;
    }
    // getter/setter 略
}
public abstract class Axis implements ChartWidget {
    protected Scale scale;
    protected Axis peerAxis;           // 正交軸(用於網格線終點)
    protected boolean drawGrid = false;
    protected Color gridColor = Color.LIGHT_GRAY;
    protected Color axisColor = Color.BLACK;
    protected int tickLength = 5;
    protected int tickCount;
    // 位置、尺寸、顏色等屬性與 getter/setter 略

    protected abstract int calculateTickLabelSize(Graphics g);
}
public abstract class Plot implements ChartWidget {
    protected XAxis xAxis;
    protected YAxis yAxis;
    protected List dataSeries = new ArrayList<>();

    public void addDataSeries(DataSeries ds) { dataSeries.add(ds); }
    public void removeDataSeries(DataSeries ds) { dataSeries.remove(ds); }

    // 總繪製入口:遍歷所有資料序列
    public void draw(Graphics g) {
        for (int i = 0; i < dataSeries.size(); i++) {
            draw(g, dataSeries.get(i), i);
        }
    }

    // 子類實現單一資料序列的繪製
    public abstract void draw(Graphics g, DataSeries ds, int index);
}
public class DataSeries {
    protected List xData = new ArrayList<>();
    protected List yData = new ArrayList<>();

    public void add(double x, double y) { xData.add(x); yData.add(y); }
    public double getX(int i) { return xData.get(i); }
    public double getY(int i) { return yData.get(i); }
    public int size() { return xData.size(); }
}
public class XAxis extends Axis {
    public XAxis(Scale scale, int tickCount) {
        this.scale = scale; this.tickCount = tickCount;
    }

    @Override
    public void draw(Graphics g) {
        if (!(scale instanceof XScale)) return;
        int ticks = getTickCount();
        int tickDist = (scale.getScreenMax() - scale.getScreenMin()) / (ticks + 1);
        int tickY = peerAxis.getScale().getScreenMin();
        int gridLength = peerAxis.getScale().getScreenMax();

        g.setColor(axisColor);
        g.drawLine(scale.getScreenMin(), tickY, scale.getScreenMax(), tickY); // 軸線

        for (int i = 0; i < ticks; i++) {
            int tickX = scale.getScreenMin() + tickDist * (i + 1);
            if (isDrawGrid()) { g.setColor(gridColor); g.drawLine(tickX, tickY, tickX, gridLength); }
            g.setColor(axisColor);
            g.drawLine(tickX, tickY, tickX, tickY + tickLength); // 刻度線
            g.drawString(String.valueOf(i+1), tickX - 5, tickY + tickLength + 12); // 標籤
        }
    }
}
public class LinePlot extends Plot {
    private Color lineColor = Color.BLUE;

    public LinePlot(DataSeries ds, XAxis xAxis, YAxis yAxis) {
        addDataSeries(ds); this.xAxis = xAxis; this.yAxis = yAxis;
    }

    @Override
    public void draw(Graphics g, DataSeries ds, int index) {
        if (ds == null) return;
        g.setColor(lineColor);

        int n = ds.size();
        int[] xPoints = new int[n];
        int[] yPoints = new int[n];

        for (int i = 0; i < n; i++) {
            xPoints[i] = xAxis.getScale().getScreenCoordinate(ds.getX(i));
            yPoints[i] = yAxis.getScale().getScreenCoordinate(ds.getY(i));
        }
        g.drawPolyline(xPoints, yPoints, n); // 一行核心代碼繪製折線
    }
}
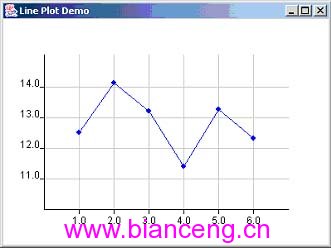
double[] y = {12.5, 14.1, 13.2, 11.4, 13.25, 12.32};
DataSeries ds = new DefaultDataSeries(y); // 僅提供 Y 值,X 自動 1,2,3...

XAxis xAxis = new XAxis(new XScale(0, y.length+1), y.length);
YAxis yAxis = new YAxis(new YScale(10, 15), 4);
xAxis.setDrawGrid(true); yAxis.setDrawGrid(true);

LinePlot plot = new LinePlot(ds, xAxis, yAxis);
Chart chart = new Chart(xAxis, yAxis, plot);

JFrame frame = new JFrame("Line Plot Demo");
frame.setSize(400, 300);
frame.getContentPane().add(chart);
frame.setVisible(true);
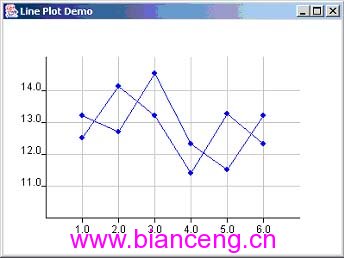
只需實作 BarPlot extends Plot,核心差異在於計算每個長條的 x, y, width, height 並呼叫 g.fillRect()。支援多組長條分組、負值處理。
// 關鍵計算邏輯節錄
int barWidth = xAxis.getWidth() / (ds.size() + 1) / dataSeries.size();
int barX = xAxis.getScale().getScreenCoordinate(i+1) - groupWidth/2 + index*barWidth;
int barY = yAxis.getScale().getScreenCoordinate(value);
int barH = yAxis.getScale().getScreenCoordinate(0) - barY; // 簡化版
g.fillRect(barX, barY, barWidth, barH);
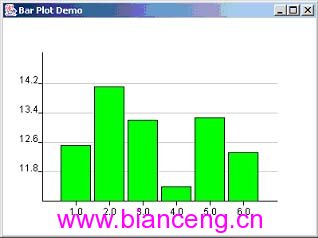
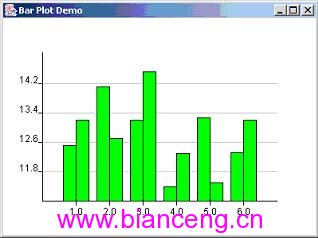
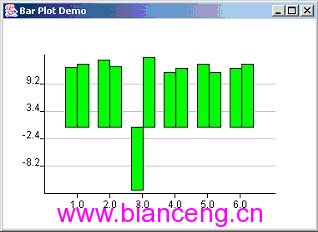
Chart chart = new Chart(xAxis, yAxis, barPlot); // 先建長條圖
chart.addPlot(linePlot);                        // 再加折線圖
DataChangeListener,收到通知呼叫 repaint()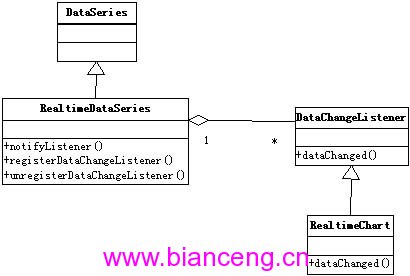
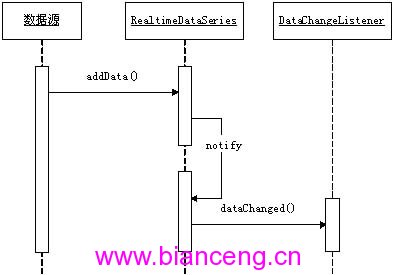
// 監聽者介面
public interface DataChangeListener {
    void dataChanged();
}

// 可觀察的資料序列
public class RealtimeDataSeries extends DataSeries {
    private List listeners = new ArrayList<>();

    public void registerDataChangeListener(DataChangeListener l) { listeners.add(l); }

    @Override
    public void add(double x, double y) {
        super.add(x, y);
        notifyListeners();
    }

    private void notifyListeners() {
        for (DataChangeListener l : listeners) l.dataChanged();
    }
}

// 即時圖表
public class RealtimeChart extends Chart implements DataChangeListener {
    @Override
    public void dataChanged() { repaint(); } // 極簡:觸發重繪
}
new Thread(() -> {
    RealtimeDataSeries ds = new RealtimeDataSeries();
    RealtimeChart chart = new RealtimeChart(xAxis, yAxis, new LinePlot(ds, xAxis, yAxis));
    chart.registerDataChangeListener(chart);

    Random r = new Random();
    while (true) {
        ds.add(System.currentTimeMillis(), 10 + r.nextDouble() * 5);
        Thread.sleep(500);
    }
}).start();
此架構極易擴展:
掌握「介面定義契約、抽象類提供骨架、具體類實現變化」的分層設計,即可構建出專屬、輕量、高度可定製的圖表元件。