tcpTrace 本質是一個 Listening/Forwarding Proxy。啟動時指定 Listening Port (如 8080) 與 Destination Host:Port (真實服務 8888)。所有發往 8080 的 HTTP Request 被攔截、顯示、再轉發至 8888;Response 同理回傳。這在 SOAP 架構中屬於 Intermediary Node 角色。
需讓客戶端將訊息發送至 tcpTrace (8080),但 SOAP Header To 仍指向真實服務 (8888)。WCF 提供 <clientVia> 端點行為實現此目的。
<endpoint address="https://localhost:8888/Calculator" binding="wsHttpBinding" contract="...ICalculator" /><endpointBehaviors>
<behavior name="traceBehavior">
<clientVia viaUri="https://localhost:8080/Calculator" />
</behavior>
</endpointBehaviors>
<client>
<endpoint address="https://localhost:8888/Calculator"
behaviorConfiguration="traceBehavior"
binding="wsHttpBinding" contract="...ICalculator" name="default" />
</client>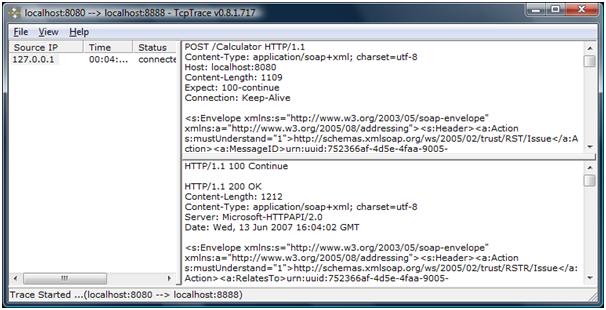
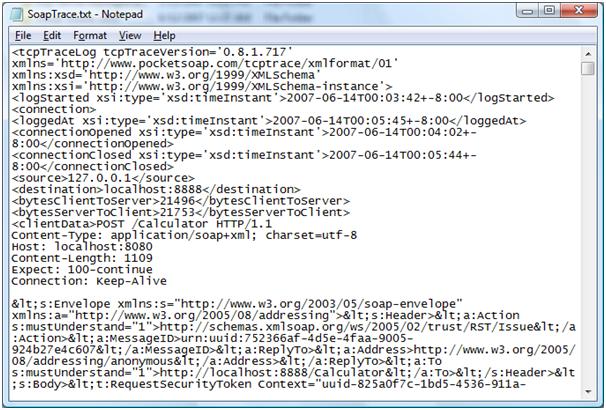
tcpTrace + ClientViaBehavior 是 WCF 開發期 SOAP 除錯的黃金組合,零侵入式、支援雙向追蹤、可持久化 Log,強烈建議納入開發工具箱。