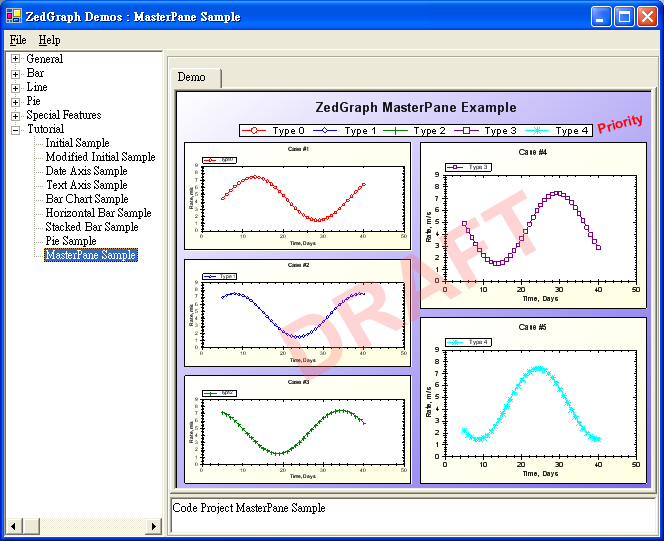
本系列基礎教學最後一篇介紹 MasterSampleDemo,展示如何使用 MasterPane 建立包含多個 GraphPane 的複合圖表,並示範浮水印、自動佈局等進階技巧。
using System;
using System.Drawing;
using System.Collections;
using ZedGraph;

namespace ZedGraph.Demo
{
    public class MasterSampleDemo : DemoBase
    {
        public MasterSampleDemo() : base("Code Project MasterPane Sample", "MasterPane Sample", DemoType.Tutorial)
        {
            MasterPane myMaster = base.MasterPane;
            myMaster.PaneList.Clear();
            myMaster.Title.Text = "ZedGraph MasterPane Example";
            myMaster.IsShowTitle = true;
            myMaster.PaneFill = new Fill(Color.White, Color.MediumSlateBlue, 45.0F);
            myMaster.MarginAll = 10;
            myMaster.Legend.IsVisible = true;
            myMaster.Legend.Position = LegendPos.TopCenter;

            // Priority 文字標籤
            TextItem text = new TextItem("Priority", 0.88F, 0.12F);
            text.Location.CoordinateFrame = CoordType.PaneFraction;
            text.FontSpec.Angle = 15.0F;
            text.FontSpec.FontColor = Color.Red;
            text.FontSpec.IsBold = true;
            text.FontSpec.Size = 15;
            text.FontSpec.Border.IsVisible = false;
            text.FontSpec.Fill.IsVisible = false;
            text.Location.AlignH = AlignH.Left;
            text.Location.AlignV = AlignV.Bottom;
            myMaster.GraphItemList.Add(text);

            // DRAFT 浮水印
            text = new TextItem("DRAFT", 0.5F, 0.5F);
            text.Location.CoordinateFrame = CoordType.PaneFraction;
            text.FontSpec.Angle = 30.0F;
            text.FontSpec.FontColor = Color.FromArgb(70, 255, 100, 100);
            text.FontSpec.IsBold = true;
            text.FontSpec.Size = 100;
            text.FontSpec.Border.IsVisible = false;
            text.FontSpec.Fill.IsVisible = false;
            text.Location.AlignH = AlignH.Center;
            text.Location.AlignV = AlignV.Center;
            text.ZOrder = ZOrder.A_InFront;
            myMaster.GraphItemList.Add(text);

            // 建立 5 個子圖表
            ColorSymbolRotator rotator = new ColorSymbolRotator();
            for (int j = 0; j < 5; j++)
            {
                GraphPane myPane = new GraphPane(new Rectangle(10, 10, 10, 10),
                    "Case #" + (j + 1), "Time, Days", "Rate, m/s");
                myPane.PaneFill = new Fill(Color.White, Color.LightYellow, 45.0F);
                myPane.BaseDimension = 6.0F;

                PointPairList list = new PointPairList();
                for (int i = 0; i < 36; i++)
                {
                    double x = (double)i + 5;
                    double y = 3.0 * (1.5 + Math.Sin((double)i * 0.2 + (double)j));
                    list.Add(x, y);
                }

                LineItem myCurve = myPane.AddCurve("Type " + j, list, rotator.NextColor, rotator.NextSymbol);
                myCurve.Symbol.Fill = new Fill(Color.White);
                myMaster.Add(myPane);
            }

            Graphics g = this.ZedGraphControl.CreateGraphics();
            myMaster.AutoPaneLayout(g, PaneLayout.ExplicitRow32);
            myMaster.AxisChange(g);
            g.Dispose();
        }
    }
}
詳細的 MasterPane、ColorSymbolRotator、ZOrder 解析請見下一篇(二)。