ChartWizard 核心參數
xlChart.ChartWizard(
    Source: cellRange.CurrentRegion,           // 數據區域
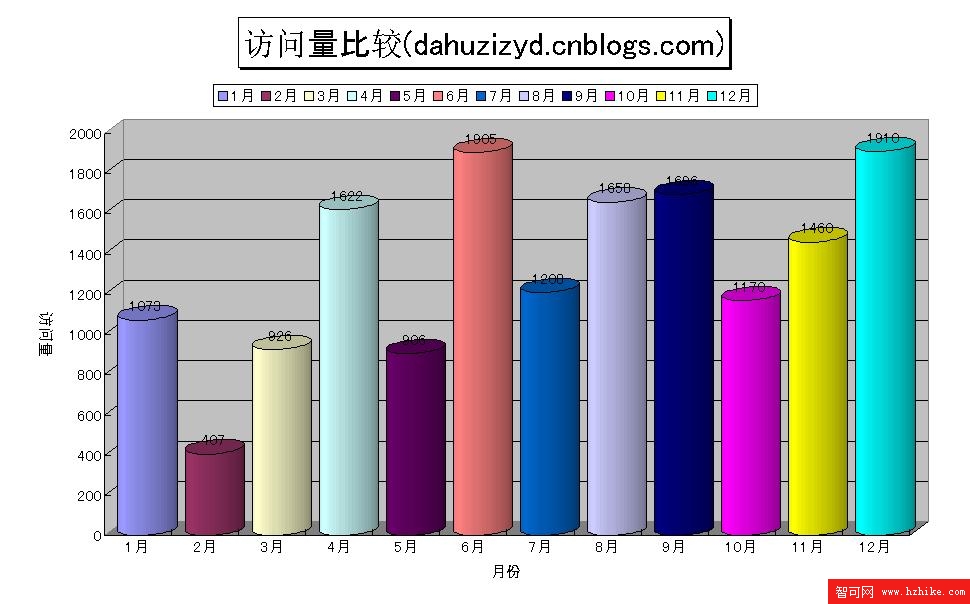
    Gallery: Excel.XlChartType.xl3DColumn,     // 3D 柱狀圖
    Format: Missing.Value,                     // 內置格式索引
    PlotBy: Excel.XlRowCol.xlColumns,          // 按列分系列
    CategoryLabels: 1,                         // 第一行作為類別標簽
    SeriesLabels: 0,                           // 第一列不作系列標簽
    HasLegend: true,                           // 顯示圖例
    Title: "訪問量比較(dahuzizyd.cnblogs.com)", // 圖表標題
    CategoryTitle: "月份",                     // X 軸標題
    ValueTitle: "訪問量",                      // Y 軸標題
    ExtraTitle: ""                             // 次標題
);
圖表樣式微調
// 圖表組
Excel.ChartGroup grp = (Excel.ChartGroup)xlChart.ChartGroups(1);
grp.GapWidth = 20;                 // 柱間距 20%
grp.VaryByCategories = true;       // 單系列時逐點著色

// 系列
Excel.Series s = (Excel.Series)grp.SeriesCollection(1);
s.BarShape = Excel.XlBarShape.xlCylinder; // 圓柱狀
s.HasDataLabels = true;                    // 顯示數值標簽

// 圖例
xlChart.Legend.Position = Excel.XlLegendPosition.xlLegendPositionTop;

// 標題
xlChart.ChartTitle.Font.Size = 24;
xlChart.ChartTitle.Shadow = true;
xlChart.ChartTitle.Border.LineStyle = Excel.XlLineStyle.xlContinuous;
座標軸精細控制
// Y 軸 (Value)
Excel.Axis valueAxis = (Excel.Axis)xlChart.Axes(Excel.XlAxisType.xlValue, Excel.XlAxisGroup.xlPrimary);
valueAxis.AxisTitle.Orientation = -90; // 垂直文字

// X 軸 (Category)
Excel.Axis catAxis = (Excel.Axis)xlChart.Axes(Excel.XlAxisType.xlCategory, Excel.XlAxisGroup.xlPrimary);
catAxis.AxisTitle.Font.Name = "MS UI Gothic";
保存與清理
wb.SaveAs(@"z:\Book2.xls", ...);
wb.Close(...); app.Quit();
Marshal.ReleaseComObject(wb); Marshal.ReleaseComObject(app);
GC.Collect(); GC.WaitForPendingFinalizers();
最終效果