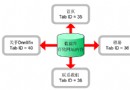
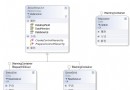
上篇建立 Insight_cs.WebCharts 類別庫,包含 PieChart、BarChart、ChartUtil 三個類別,皆提供 Render(title, subTitle, width, height, DataSet, Stream) 方法。
<%@ Page ContentType="image/gif" Language="C#" AutoEventWireup="false"
    Codebehind="SalesChart.aspx.cs" Inherits="Insight_cs.SalesChart" %>
ContentType="image/gif" 直接輸出圖片串流,可用於 <img src="SalesChart.aspx?type=PIE&width=400&height=300" />。private void Page_Load(object sender, EventArgs e) {
// 1. 取得資料
string sql = @"SELECT Year(ord_date) As [Year], SUM(qty) As [Qty]
FROM sales sa INNER JOIN stores st ON sa.stor_id = st.stor_id
GROUP BY Year(ord_date) ORDER BY [Year]";
var da = new SqlDataAdapter(sql, connStr);
var ds = new DataSet();
int rows = da.Fill(ds, "chartData");
// 2. 讀取查詢字串參數
string type = Request["type"]?.ToUpper() ?? "PIE";
int width = int.TryParse(Request["width"], out var w) ? w : 400;
int height = int.TryParse(Request["height"], out var h) ? h : 400;
string title = Request["title"] ?? "";
string subTitle = Request["subtitle"] ?? "";
// 3. 依類型渲染
if (rows > 0) {
switch (type) {
case "PIE": new PieChart().Render(title, subTitle, width, height, ds, Response.OutputStream); break;
case "BAR": new BarChart().Render(title, subTitle, width, height, ds, Response.OutputStream); break;
}
}
}
SalesChart.aspx 及代碼後置。<img src="SalesChart.aspx?type=BAR&title=年度銷售" /> 嵌入動態圖表。