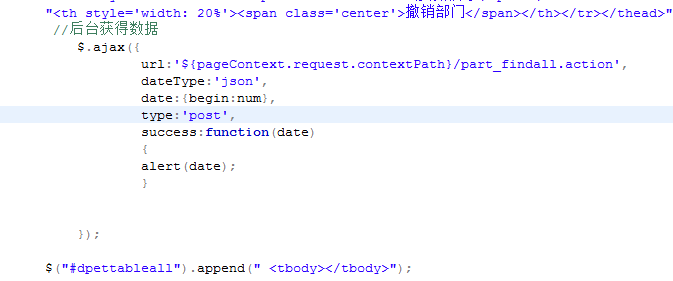
使用 AJAX 獲取兩個數組 `arr1`(節點)、`arr2`(連線),需動態填充 ECharts 力導向圖的 `nodes` 和 `links` 配置項。原代碼將圖表初始化代碼放在 AJAX 外部,導致圖表渲染時數據尚未返回,顯示空白。
$.ajax({ ..., success: function(result){ ... arr1.push(...); arr2.push(...); } });
// 此處圖表初始化代碼已執行,但 arr1/arr2 仍為空
require([...], function(ec){
    var option = { series: [{ nodes: [arr1], links: [arr2] }] }; // 錯誤:嵌套數組
    myChart.setOption(option);
});<div id="main" style="height:500px;"></div>
<script src="./js/jquery-1.8.3.min.js"></script>
<script src="./js/echarts.js"></script>
<script>
require.config({ paths: { echarts: './js' } });
$.ajax({
type: "POST",
url: "mapdata.php",
dataType: "json",
success: function(result) {
var nodes = [], links = [];
// 假設 result 為 [{category:0, name:'A', value:10, source:'A', target:'B', weight:5, name_nexus:'rel'}, ...]
var map = {}; // 用於去重節點
result.forEach(function(item) {
// 構建節點(去重)
if (!map[item.name]) {
nodes.push({
name: item.name,
value: item.value,
category: item.category
});
map[item.name] = true;
}
// 構建連線
links.push({
source: item.source,
target: item.target,
weight: item.weight,
name: item.name_nexus
});
});
// 圖表初始化
require(['echarts', 'echarts/chart/force'], function(ec) {
var myChart = ec.init(document.getElementById("main"));
var option = {
title: { text: '人物關系:葛優', x: 'right', y: 'bottom' },
tooltip: { trigger: 'item', formatter: '{a} : {b}' },
legend: { x: 'left', data: ['家人','朋友'] },
series: [{
type: 'force',
name: "人物關系",
ribbonType: false,
categories: [{name:'人物'},{name:'家人'},{name:'朋友'}],
itemStyle: {
normal: {
label: { show: true, textStyle: { color: '#333' } },
nodeStyle: { brushType: 'both', borderColor: 'rgba(255,215,0,0.4)', borderWidth: 1 },
linkStyle: { type: 'curve' }
}
},
useWorker: false,
minRadius: 15,
maxRadius: 25,
gravity: 1.1,
scaling: 1.1,
roam: 'move',
nodes: nodes, // 直接賦值
links: links
}]
};
myChart.setOption(option);
});
},
error: function() { alert("請求數據失敗!"); }
});
</script>