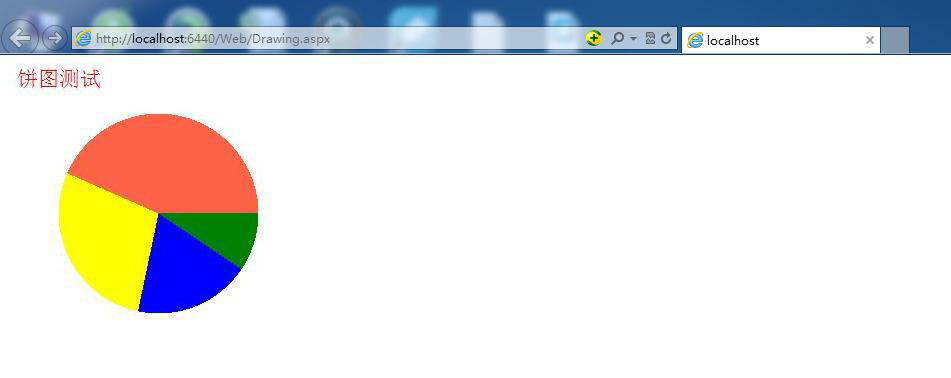
在 ASP.NET WebForms 專案中,若不想引入第三方圖表套件,可直接使用 `System.Drawing` 命名空間的 GDI+ 功能,在伺服器端動態繪製圖表並輸出為圖片串流。本文示範如何繪製基本圓餅圖與加上邊框的進階版本。
public partial class Drawing : System.Web.UI.Page
{
    protected void Page_Load(object sender, EventArgs e)
    {
        // 1. 準備資料與顏色
        int[] data = { 100, 200, 300, 460 };
        Color[] colors = { Color.Green, Color.Blue, Color.Yellow, Color.Tomato };

        // 2. 建立畫布
        Bitmap bm = new Bitmap(400, 400);
        Graphics g = Graphics.FromImage(bm);
        g.Clear(Color.White);
        g.SmoothingMode = System.Drawing.Drawing2D.SmoothingMode.AntiAlias; // 抗鋸齒

        // 3. 繪製標題
        g.DrawString("圓餅圖測試", new Font("微軟正黑體", 16), Brushes.Red, new PointF(5, 5));

        // 4. 計算總值
        float totalValue = 0;
        foreach (int val in data) totalValue += val;

        // 5. 繪製各扇形區塊
        float startAngle = 0;
        float x = 50f, y = 50f, width = 200f;
        int index = 0;

        foreach (int val in data)
        {
            float sweepAngle = val / totalValue * 360;
            g.FillPie(new SolidBrush(colors[index++]), x, y, width, width, startAngle, sweepAngle);
            startAngle += sweepAngle;
        }

        // 6. 輸出圖片串流
        bm.Save(Response.OutputStream, ImageFormat.Jpeg);
        g.Dispose();
        bm.Dispose();
    }
}
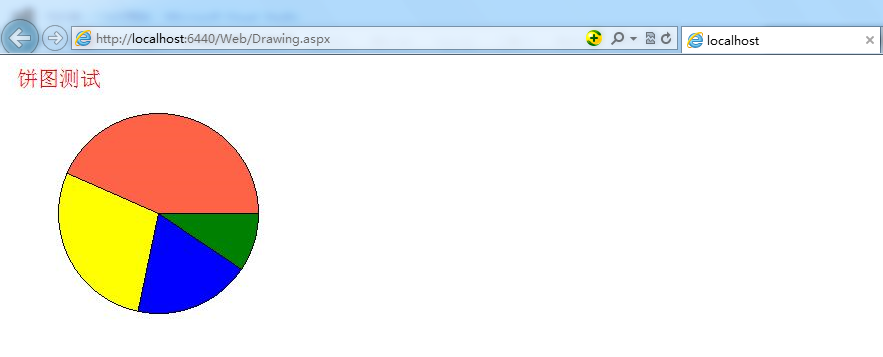
只需在 `FillPie` 之後加上 `DrawPie` 即可繪製邊框:
foreach (int val in data)
{
    float sweepAngle = val / totalValue * 360;
    g.FillPie(new SolidBrush(colors[index]), x, y, width, width, startAngle, sweepAngle);
    g.DrawPie(Pens.Black, x, y, width, width, startAngle, sweepAngle); // 加上黑色邊框
    startAngle += sweepAngle;
    index++;
}
在 .aspx 頁面中直接以 `` 標籤指向此 .aspx 頁面:
<img src="Drawing.aspx" alt="動態圓餅圖" />透過 `System.Drawing` 繪製圓餅圖雖然程式碼較繁瑣,但無需外部依賴,適合簡單報表需求。實務專案建議考慮使用 Chart.js、Highcharts 等前端圖表庫,或伺服端的 NPOI、EPPlus 等成熟方案,以獲得更好的互動性與維護性。